|
 Used by businesses, news outlets, and even governmental and educational organizations, infographics combine words, numbers, and imagery into visually stimulating and dynamic ways of representing data and information. They can convey message and meaning in a quicker and more efficient manner than text alone when attention is paid to quality and content in their creation (Kos & Sims, 2014). Infographics are engaging to both create and to read, meaning that they’re also great for language learning. Used by businesses, news outlets, and even governmental and educational organizations, infographics combine words, numbers, and imagery into visually stimulating and dynamic ways of representing data and information. They can convey message and meaning in a quicker and more efficient manner than text alone when attention is paid to quality and content in their creation (Kos & Sims, 2014). Infographics are engaging to both create and to read, meaning that they’re also great for language learning.
Because they incorporate both words and visuals, infographics provide an overlap between linguistic and nonlinguistic communication systems. The more students are able to navigate these systems, the better they are at storing, recalling, and applying new information (Krauss, 2012). Connecting linguistic and social ideas to students’ own work within an infographic makes the content more meaningful and personal, thus retaining interest and promoting engagement. Furthermore, combining linguistics and imagery can promote critical thinking and serve as catalysts for verbal and written expression among English language learners (Ewald, n.d).
Because of infographics’ increasing familiarity to students and ability to grab and maintain interest, I find that I spend less time promoting buy-in and instead can jump right into utilizing their potential as language learning tools with my students who are learning English.
 Creating Infographics Creating Infographics
It’s important to spend some time looking at infographics and discussing their components before diving into the infographic-making application and the projects. If you are new to designing infographics yourself, Greenfield (2011) has a great article entitled “A Few Rules for Making Homemade Infographics” that is an excellent starting point. Doing an image search of infographics and having students work in pairs to talk about and write down all of the things they notice that infographics have or do is a great communicative activity and introduction to infographics as a whole. Some of the things the students may notice and that you should talk about as a class are
-
color schemes/themes (three to four colors that work together);
-
icons (what they are and how they’re used);
-
images, charts and graphs, background (distracting or enhancing);
-
text color(s);
-
font usage (with three different fonts being the magic number for variety); and
-
layout (negative space, no overcrowding, coherence, and other formatting concerns).
There are plenty of free online infographic generators, but my personal favorite is Piktochart because of its ease of use and flexibility of customization even in the free version, but others, such as Visme, Infogr.am, and Venngage, will work just as well. No matter which application you choose to use, it’s important that you play around with it and make a few infographics yourself before introducing it to your students. You’ll want to have some examples to show them (especially if you’re doing a specific project) and you’ll be better equipped to help them navigate the application themselves.
Infographic Activities for Language Learning
 Almost all of the following activities can be modified for various levels and are great for incorporating infographics into your English language classroom and objectives. Almost all of the following activities can be modified for various levels and are great for incorporating infographics into your English language classroom and objectives.
Summarizing Reading Assignments
After reading an article, essay, or short story, students can then summarize it using a five-, seven-, or nine-point infographic (depending on the length of the reading). Each point on the infographic will summarize an aspect of the reading by using an icon or image and just a few words (or a short sentence). The 50/50 Rule (see Additional Tips) should apply here, meaning that students will have to have a good grasp of the content to properly convey each part of the summary.
 Biographies and Autobiographies Biographies and Autobiographies
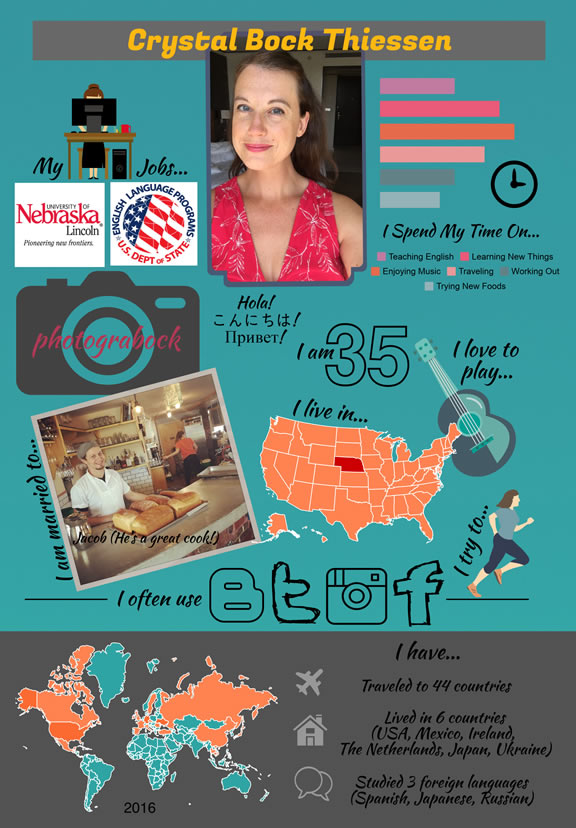
When researching historical or famous people, or when presenting information about themselves, students love to use infographics as a fun way to present the information. You’ll want to give the students plenty of time to study examples of biographic infographics online to give them ideas on how they can present information about people. Encourage students to include at least one chart or graph, such as a timeline visualization of how they spend their free time.
Introduction to Research and Research Presentation
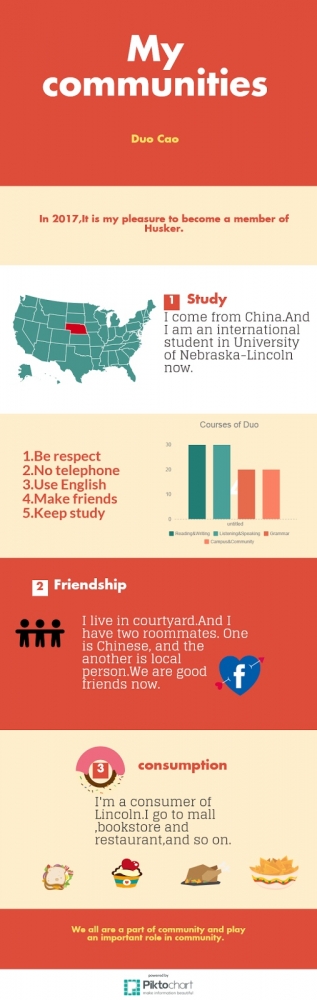
Presenting data in a visually stimulating infographic can help to teach students that how information is presented is just as important as the actual information itself. Combined with summarizing activities, using infographics can teach, on an introductory level, the ideas behind academic research. In our unit on the environment, for example, I had my low intermediate students each draw an environmental problem out of a hat. The students then had to find three online sources and choose information they wanted to include on their infographic from each one. Once the students had their sources and information, we were then able to work on strategies for simplifying the original copied information into easier summaries in their own words, and then to convey that simplification using the features of an infographic.
Using a template I made that detailed how they were to organize each block of their infographic, students then took their research and transformed it into an original and organized infographic:
|
Infographic Title
Your name (a little smaller) |
|
2–3 facts about the problem (from your research) |
|
2–3 solutions to the problem (from your research) |
|
3 things that we can easily do to help this problem (from your research and experience) |
|
Your three online sources listed (Author name, date, title, website) |
Figure 1. Example infographic template for introducing research and poster presentations. Each block on the template corresponds to a different block in the infographic.
Each block of the infographic could then be printed out and connected together to create a long poster, and these posters are what we used to give research poster presentations to peers and other instructors in our department, giving the students a chance to practice speaking about the concepts they researched. (See Appendix A [.docx], the Poster Presentation Rubric)
Debate, Analysis, and Comparative Studies
Infographics are a great way to have students map out opposing sides or views on an issue. This is especially helpful when teaching debate because students usually have to prepare for or investigate at least two sides of a particular topic. Alternatively, visually representing comparisons can help students in making connections among certain topics or ideas. The ease with which students can enter data into an infographic application and have it immediately converted into a variety of different charts and graphs makes analyzing data from readings or from student-conducted interviews a lot more interesting and engaging.
Grammar and Idiom Review
Students can work together in groups to make infographics on particular grammar points in class or to illustrate learned idioms, which they can then present to a group or the class as a whole in the role of a teacher. As a teacher yourself, you can also make your own course content-specific infographics to help students with grammatical concepts that may be particularly difficult for them.
 Writing Practice and Writing Connections Writing Practice and Writing Connections
Although infographics are a highly visual way of communicating ideas, there’s no reason why they can’t be paired with writing assignments for a truly dynamic learning experience. On the internet, there is an infographic on just about any topic for students to choose and write about. Students can write more formal paragraphs or short essays detailing the information presented in their own infographics. They can also practice summarizing key ideas from their essays by creating an infographic of it as a cover, or by creating an infographic of a classmate’s writing, providing great summarizing practice, a key skill that is often difficult for students to grasp in English.
Additional Tips on Using Infographics With Students
-
Teach about the 50/50 Rule: a successful infographic generally will contain about 50% words and 50% icons/imagery. Have students think about which words and ideas can be represented by icons. Alternatively, cryptic or vague icons will need a few words to fully convey the message.
-
Practice data analysis: Have students practice analyzing data verbally or in writing from infographics that are already published online or in print. This is especially helpful when introducing or working on research writing.
-
Prepare students properly: Go through your infographic-making software with students first to familiarize them with all the tools available to them. Students are quick to figure out online applications, but sometimes it helps to get a brief overview of what tools and functions there are before setting them free with it.
-
Use rubrics: Use rubrics for both student peer-editing (Appendix B [.docx]) and for final grading (Appendix C [.docx]). For the student peer edits, infographics are brought up on the laptops and are merely viewed from there.
-
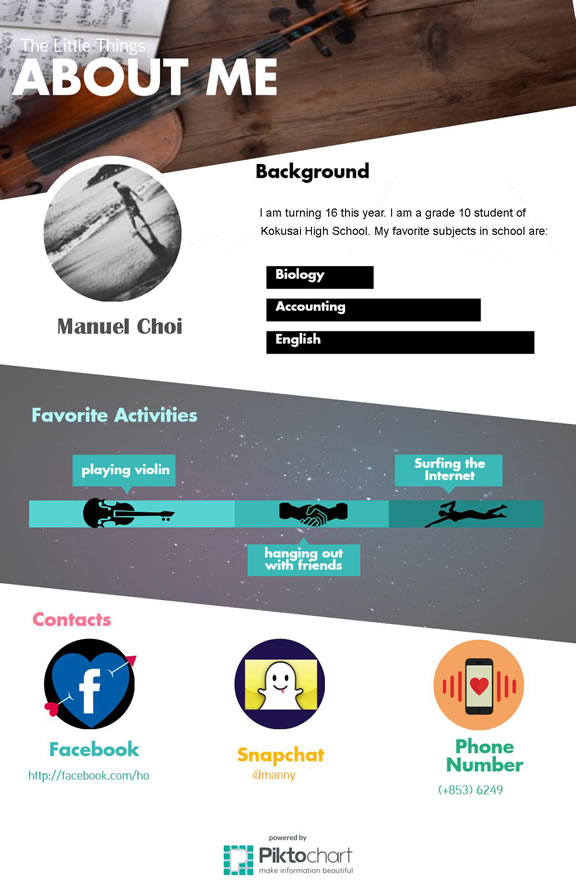
Let students practice: Give students opportunities for practicing before they have to create larger projects. Printables are one-page versions of infographics, which are longer and are usually printed out in blocks. Making “About Me” printables is a great place to start.
References
Ewald, W. (n.d.). Literacy through photography. Retrieved from https://literacythroughphotography.wordpress.com/
Greenfield, R. (2011, July 13). A few rules for making homemade infographics. The Atlantic. Retrieved from https://www.theatlantic.com/technology/archive/2011/07/few-rules-making-homemade-infographics/352800/
Kos, B. A., Sims, E. (2014, October 23–24). Infographics: The new 5-paragraph essay. Paper presented at the Rocky Mountain Celebration of Women in Computing, Laramie, WY. Retrieved from http://scholar.colorado.edu/cgi/viewcontent.cgi?article=1001&context=atlas_gradpapers
Krauss, J. (2012). Infographics: More than words can say. Learning & Leading with Technology,39(5), 10–14. Retrieved from https://files.eric.ed.gov/fulltext/EJ982831.pdf
Crystal Bock Thiessen graduated with bachelor’s degrees in both photography and Spanish and received her Master’s in TESL from the University of Central Missouri. Professionally, her interests include team-teaching, photography, and video for the language classroom, and language learning through community engagement. Currently, she is an ESL instructor at the University of Nebraska-Lincoln and is also a professional photographer. Combined with her love of travel, she has photographed and visited 46 countries and 29 U.S. states.
|

